R&D KPIs
Key performance indicators (KPIs) are used within PCP R&D to better understand, control, and manage the organization.
This guide describes the principles of KPIs, the standard KPIs for R&D releases, and the roles and responsibilities involved in KPIs.
Intended for
Quality control managers (QCMs) and release owners.
Principles
Some KPIs describe the outcome of an event, while others indicate a potential future result. At PCP R&D, the focus is on KPIs that help to act in time to meet expected results.
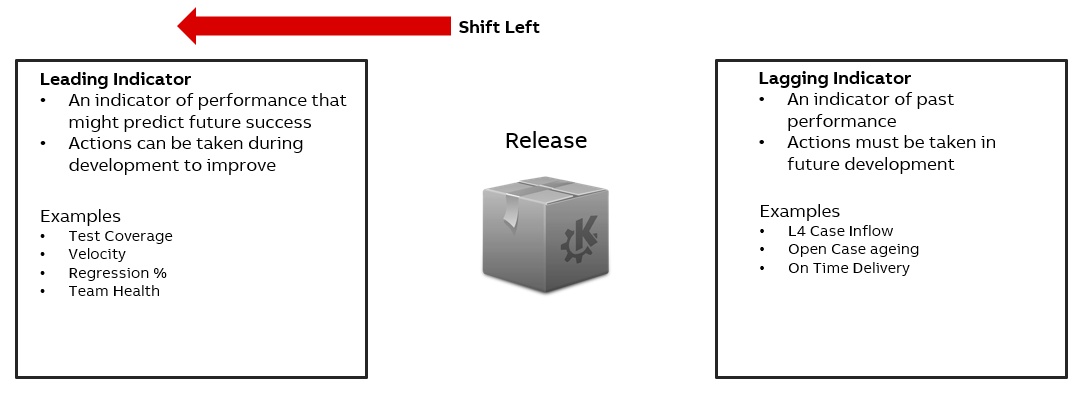 Examples of different indicators.
KPIs on different levels
In PCP, the overall focus is on on-time delivery, cost, quality, and innovation. In R&D, different levels contribute to this in their specific way:
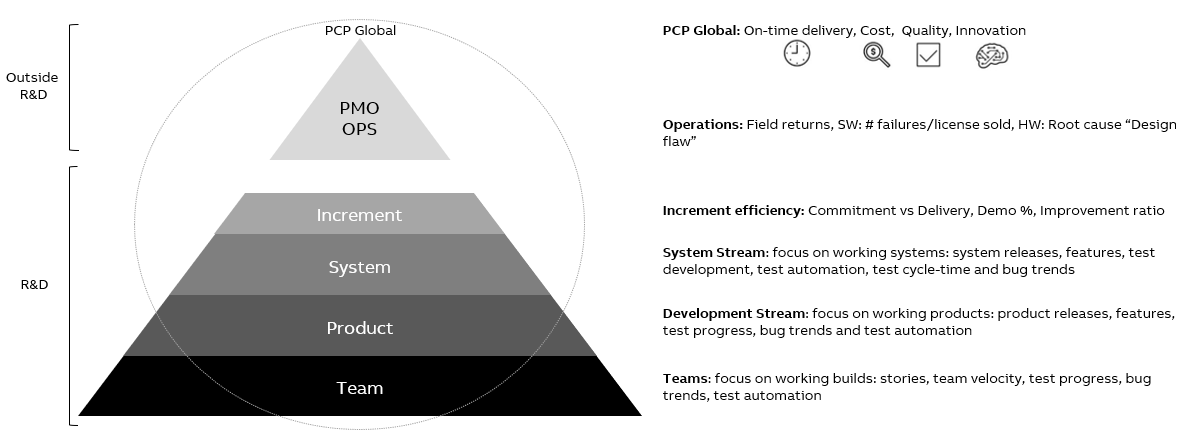 The different levels with examples of what they measure and follow up.
Roles and responsibilities
The key roles involved with working with KPIs:
- Quality team provides standard
- Provides standard KPI set.
- Provides standard discipline dashboard.
- Provides standard Power BI dashboard.
- Release owner
- Proposes release-specific KPIs in the quality plan (QCM can help if needed).
This includes adding/deleting KPIs as well as setting specific targets. - Owns release-specific dashboards (QCM can help if needed).
- Reports data to the steering group.
- Proposes release-specific KPIs in the quality plan (QCM can help if needed).
- Steering group
- Approves quality plan with KPIs.
- Decides on release, based on data provided.
- Product owner / development teams
- Keep work item data updated.
Standard KPIs for releases
| ID | Description | Motivation | Type | Target (recommended) | Measured (where/when) |
|---|---|---|---|---|---|
| M1 | Completion (burndown) of system epics. <System level> | To control release progress. | Scope | 100% done at G5. | ADO Bi-weekly |
| M2 | System epics distribution per state. <System level> | To control release progress. | Scope | No target, continuously monitored. | ADO Bi-weekly |
| M3 | Completion of epics by effort (burndown). This metric will add-up the effort of underlying features which are not in closed/done state. <Product level> | To control release progress. | Scope | 100% done at M5. | Power BI R&D Dashboard / ADO Bi-weekly |
| M4 | Epics distribution by state and effort. For effort: this metric will add-up the effort of underlying features. <Product level> | To control release progress. | Scope | 100% done at M5, continuously monitored. | Power BI R&D Dashboard / ADO Bi-weekly |
| M5 | Completion (burndown) of features. <Product level> | To control release progress. | Scope | 100% done at M5. | ADO Bi-weekly |
| M6 | Features list by states. <Product level> | To control release progress. | Scope | No target, continuously monitored. | Power BI R&D Dashboard / ADO Bi-weekly |
| M7 | Completion of the scope bugs (Open Bugs Trend). Scope bugs: bugs detected in previous releases and targeted to be fixed in the current release. <Product level> | To control release progress. | Scope | All bugs closed (fixed, will not fix, deferred, as design ...) at M5. | Power BI R&D Dashboard / ADO Bi-weekly |
| M8 | Completion of the introduced bugs (Open Bugs Trend). Introduced bugs: bugs detected in the current release. <Product level> | To follow up of introduced bugs in the release. | Quality | All bugs closed (fixed, will not fix, deferred, as design ...) at M5. | Power BI R&D Dashboard / ADO Bi-weekly |
| M9 | Number of added/removed system epics after G2. <System level> | To follow up on scope volatility. | Scope | No target, continuously monitored. | ADO Bi-weekly |
| M10 | Number of added/removed epics after G2. <Product level> | To follow up on scope volatility. | Scope | No target, continuously monitored. | ADO Bi-weekly |
| M11 | Number of added/removed scope bugs after G2. Scope bugs: bugs detected in previous releases and targeted to be fixed in the current release. <Product level> | To follow up on scope volatility. | Quality | No target, continuously monitored. | ADO Bi-weekly |
| M12 | Open bugs distribution per product, severity, state, how found (originator). <Product level> | To follow up on bug status. | Quality | No target, continuously monitored. | Power BI R&D Dashboard / ADO Bi-weekly |
| M13 | Bugs introduced by the release: inflow and remain-ing bugs shown by severity. <Product level> | To follow up on bug status. | Quality | >2 weeks of de-creasing trend (inflow and open bugs) during active testing before setting M5. | Power BI R&D Dashboard / ADO Bi-weekly |
| M14 | Number of critical and high bugs not fixed (imple-mented and integrated in build) at M4. <Product level> | To follow up on bug status. | Quality | 0 | Power BI R&D Dashboard / ADO Bi-weekly |
| M15 | Number of deferred bugs. Metric should be available for all bugs, scope bugs and introduced bugs. <Product level> | To follow up on bug status. | Quality | No target, continuously monitored. | Power BI R&D Dashboard / ADO Bi-weekly |
| M16 | Product test (PT) status: total, passed, failed and blocked. Metric should be able to be sliced on unique test points and all test points. <Product level> | To follow up on status of PT. | Quality | 0 blocked by M4 0 blocked by M5 0 Failed test cases not properly addressed/tracked (release notes, test report...) at M5. | Power BI R&D Dashboard / ADO Bi-weekly |
| M17 | System test (ST) status: total, passed, failed and blocked. Metric should be able to be sliced on unique test points and all test points. <System level> | To follow up on status of ST. | Quality | 0 blocked by G4 0 blocked by G5 0 Failed test cases not properly addressed/tracked (release notes, test report...) at G5. | Power BI R&D Dashboard / ADO Bi-weekly |
| M18 | Unit test coverage (on new and changed code) <Product level> | To follow up on code quality. | Quality | >80% | SonarQube or similar Bi-weekly |
| M19 | Static code analysis coverage (%) <Product level> | To follow up on code quality. | Quality | 100% | SonarQube or similar Bi-weekly |
| M20 | Fix rate of static code analysis warnings/errors (%) <Product level> | To follow up on code quality. | Quality | >80% | SonarQube or similar Bi-weekly |
| M21 | Data quality dashboard: missing data, parent-child relationship issues, open items in old iterations <System level and Product level> | To follow up on process adherence. | Quality | Green (no errors). | ADO Bi-weekly |
| M22 | Monthly spending <System level and Product level> | To control budget. | Cost | According to budget. | SAP Monthly |
| M23 | Gate/MS on time <System level and Product level> | To control time schedule. | Time | 100% | SAP Monthly |
| M24 | Epics/features test coverage by product tests. This metric will look for linked test cases in ADO. The epic pie chart will account for underlying features. <Product level> | To follow up test quality. | Quality | >85% | Power BI R&D Dashboard / ADO Bi-weekly |
| M25 | Epics/features test coverage by system tests. This metric will look for linked test cases in ADO. The epic pie chart will account for underlying features. <System level> | To follow up test quality. | Quality | >85% | Power BI R&D Dashboard / ADO Bi-weekly |
| M26 | Product tests automation coverage. <Product level> | To follow up test quality. | Quality | >80% | Power BI R&D Dashboard / ADO Bi-weekly |
| M27 | System tests automation coverage. <System level> | To follow up test quality. | Quality | >80% | Power BI R&D Dashboard / ADO Bi-weekly |
| M28 | System Integration Test Automation coverage | To follow up test quality. | Quality | >80% | Power BI R&D Dashboard Bi-weekly |
| M29 | Security Vulnerabilities # of security vulnerabilities (SonarQube, BlackDuck, DSAC, Bugs) | To follow up on code quality. | Quality | 0 (zero) unreviewed bugs at M5 or component release | Azure Devops (dashboard + release pipeline gates) Bi-weekly |
| M30 | Bug answering performance The answer time needed to set a bug to the “Closed” status from the moment it is received. It is measured in order to keep bug backlog under control. | To follow up on bug status. | Quality | 0 bugs older than 3 months | Azure Devops Bi-weekly |
| M31 | Critical, high severity and priority 1 bug handling Important defects are resolved in a timely manner. | To follow up on bug status. | Quality | 0 Critical, High or Prio 1 bugs are older than 2 weeks | Azure Devops Bi-weekly |
| M32 | Bug leakage from development Customers, Pilots, FI-STT and SIT are finding % of bugs that were supposed to be caught by a previous level of testing (development teams). | To follow up on bug status. | Quality | <10% | Azure Devops Bi-weekly |