Data Discipline Dashboard
The quality dashboard can help teams measure and compare product quality by setting appropriate widgets and queries. A common template based on standardized queries will help save effort and improve efficiency. By setting appropriate widgets and queries, the quality dashboard can help teams measure and compare product quality. A template based on standardized queries helps save effort and improve efficiency.
This guide sets a standard data discipline dashboard template in Azure DevOps (ADO) and guides how to customize it for a project.
Intended for
Quality control managers, release owners, and product owners.
Introduction
The data discipline dashboard is a built-in quality practice that is part of the quality dashboard. It aims to help development teams check the data quality of work items by themselves and further improve the transparency and accuracy of the dashboard for key performance indicators (KPIs).
Layout
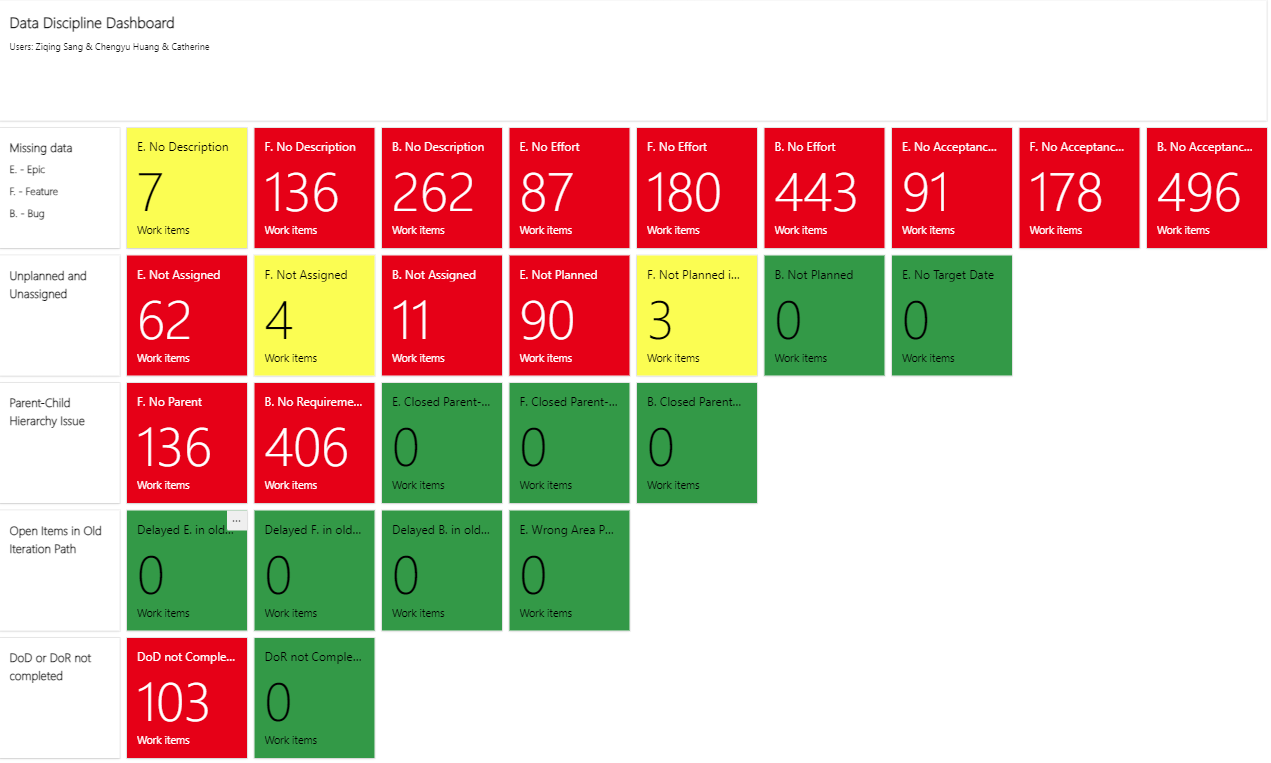
Structure
| Type | Widgets |
|---|---|
| General | a. Missing data. Epics/features/bugs are active but without description/effort / acceptance criteria. b. Unplanned and Unassigned. Epics/features/bugs are active but not planned or assigned; Epics no target date. c. Parent-child hierachy issue. Active features without parents; Active bugs without requirements; Active epics/features/bugs with closed parent but open child. d. Open items in old iteration path. Epics/features/bugs are active but delayed in old path; Active epics in wrong area path. e. DoD or DoR not completed. Uncompleted DoD or DoR. |
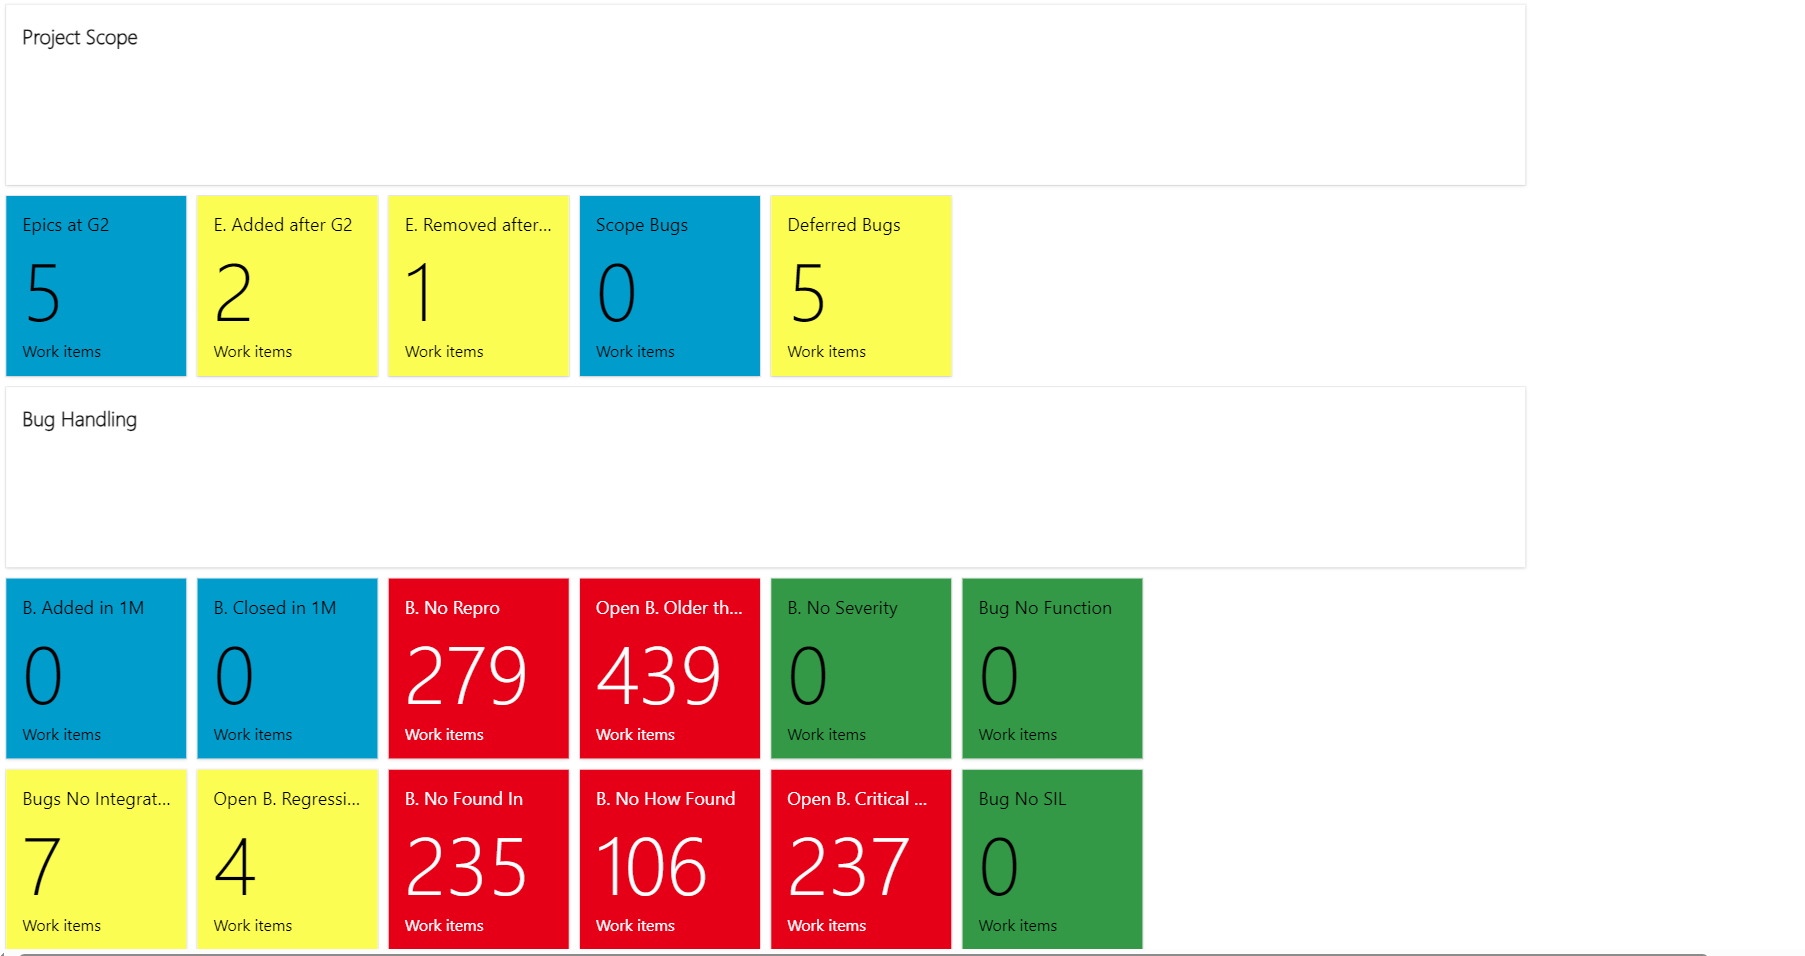
| Project scope | a. Epics scope. Epics at G2; Epics added after G2; Epics removed after G2. b.Scope bugs. Scope bugs; Deferred bugs. |
| Bug handling | a. Missing data of bugs. Open bugs without repro / How found / Severity / Found in / SIL / Function / Integrated build; Open bugs critical high/regression. b. Bug aging. Bugs added in 1 month; Bugs closed in 1 month; Open bugs older than one PI. |
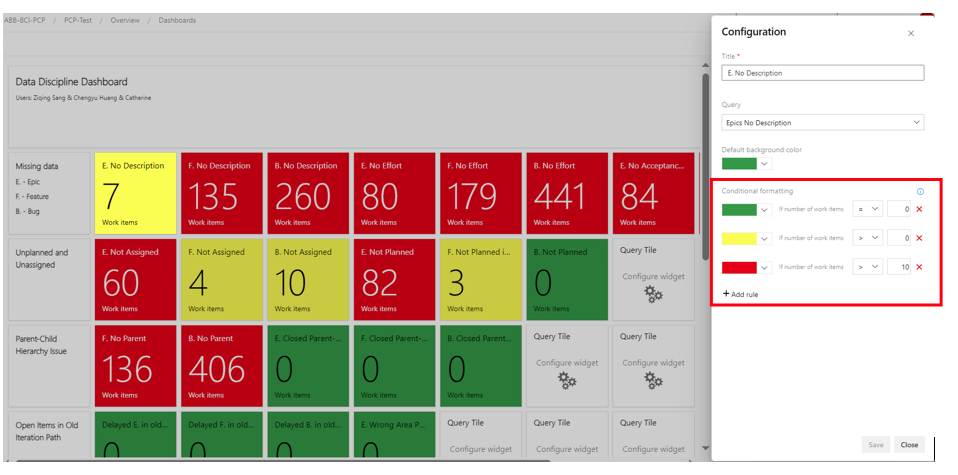
Color standard
| Color | Green | Yellow | Red | Blue |
|---|---|---|---|---|
| Number of work items | 0 | 1-10 | >10 | Not relevant (as a baseline). |
| Examples |  |  |  |  |
People & Frequency
| People involved | Roles |
|---|---|
| Creator | Release owner, scrum master, configuration manager, development team. |
| User | Development team. |
| Frequency of use | Checking the data discipline dashboard once a week is recommended. |
| Supervisor | Quality control manager, release owner. |
How to create and edit a dashboard
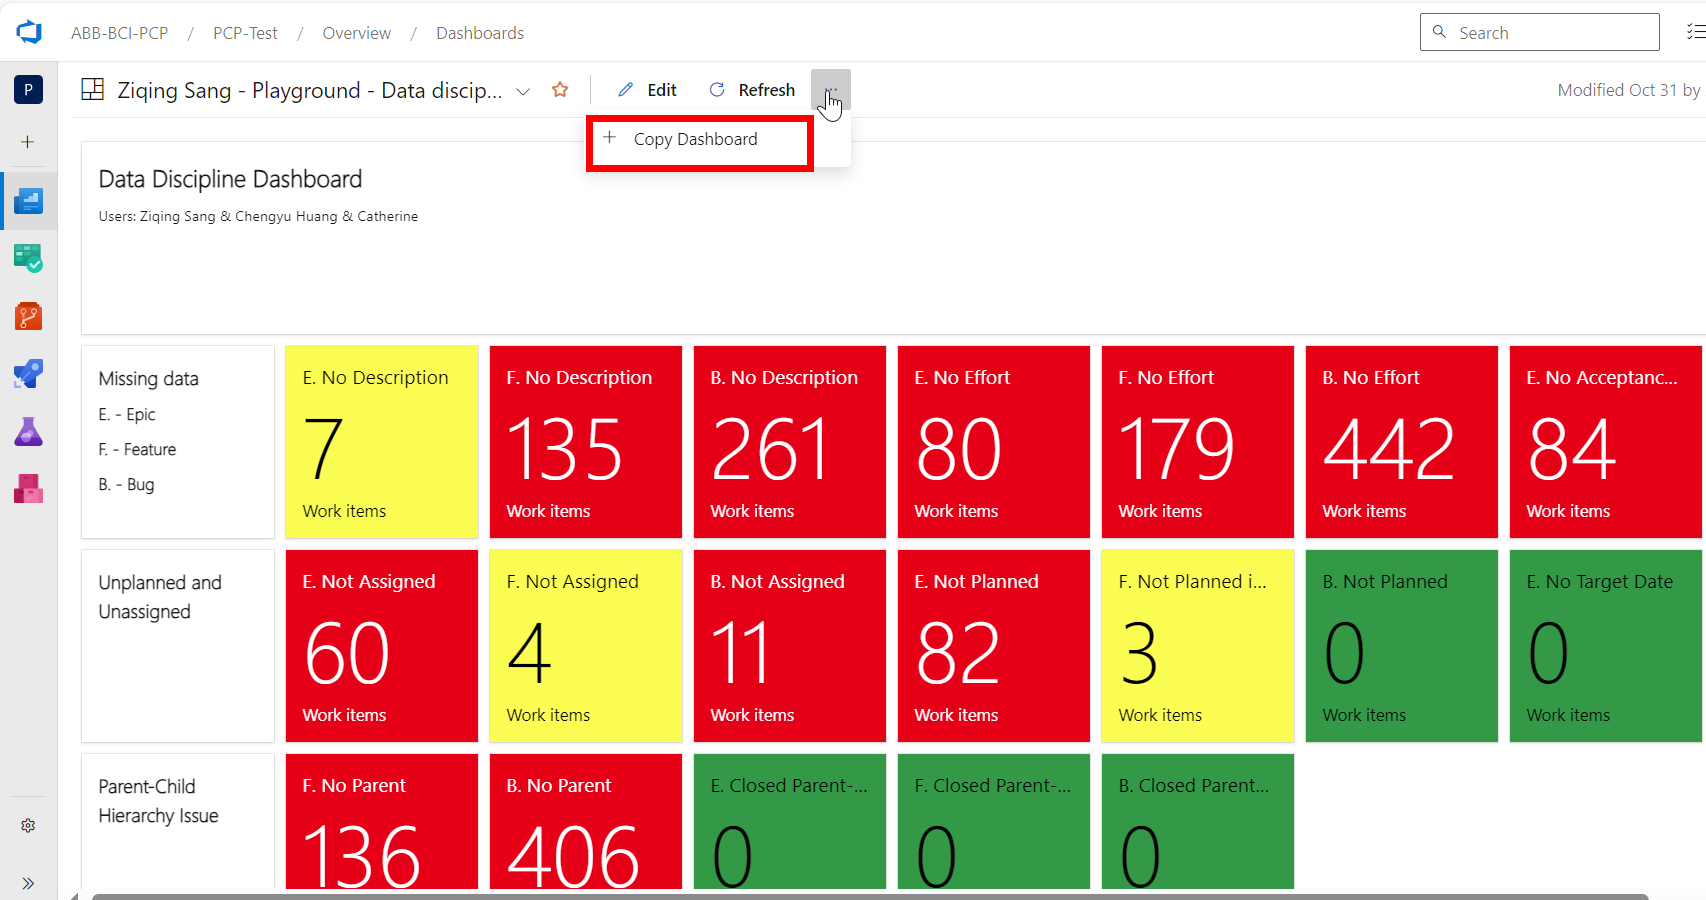
Copy this template to create a new dashboard for a project. Choose "Copy Dashboard".
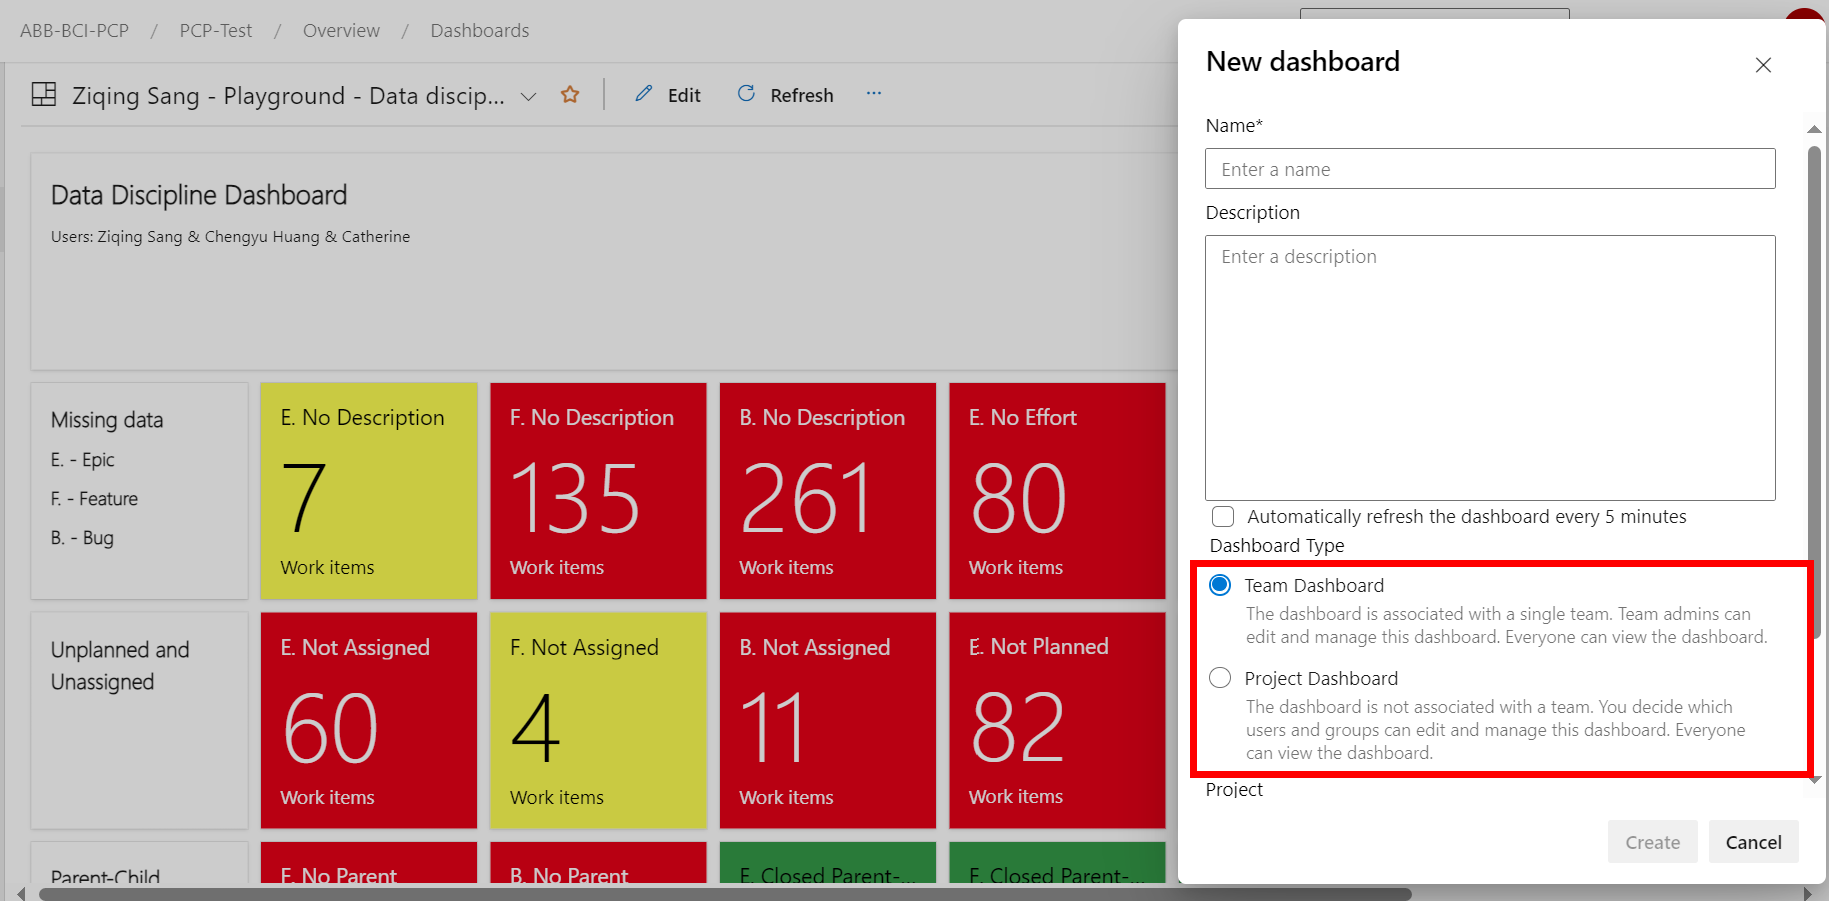
Fill in the information about the new dashboard here. Choose "Project Dashboard" in the "Dashboard Type" part. A project dashboard can involve different teams.
The related queries are automatically copied when copying the dashboard. These queries can then be reused.
It is also possible to customize the dashboard by editing widgets. The data discipline dashboard mainly involves two kinds of widgets: Markdown and Query tile.
Markdown
Markdown is a lightweight markup language. It adds simple formatting elements to the text, keeping the text readable in any text editor.
In the data discipline dashboard, Markdown can be used to show some basic information about the project, like names of the project, categories, explanations, etc.
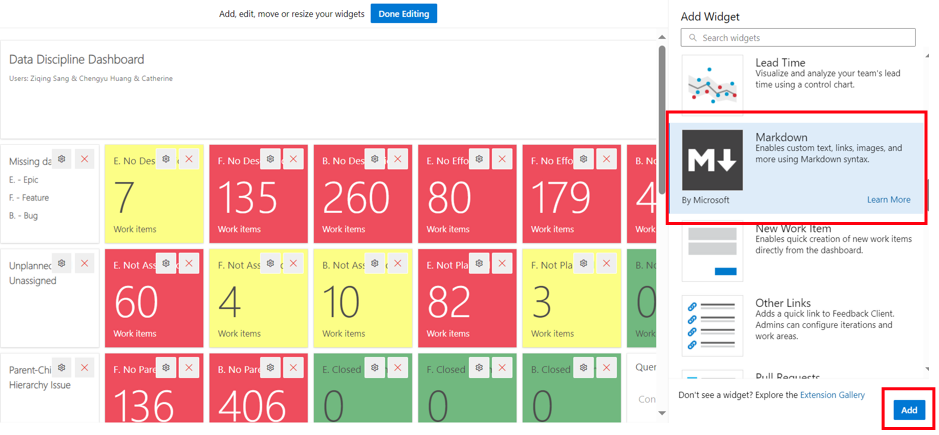
Select “Configure” to edit the Markdown. You can change the width and length of the Markdown, and add also the text.
Learn more about Markdown in Tutorial: Markdown in ADO.
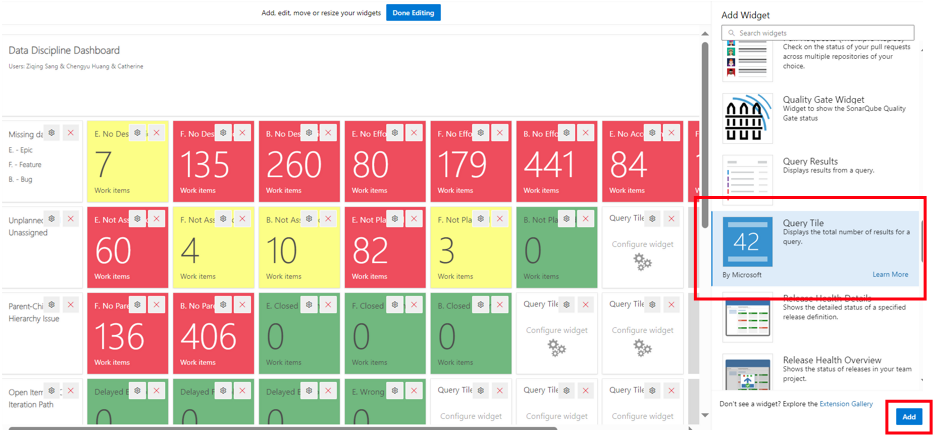
Query tile
Query tile is a configurable tile that displays the summary of shared query results. From the configuration dialog, select either a team favorite or a shared query. Rules can also be specified to change the query tile color based on the number of work items returned by the query.
In below dashboard, query tiles can be used to visualize the data status. Different colors show different urgency degrees.
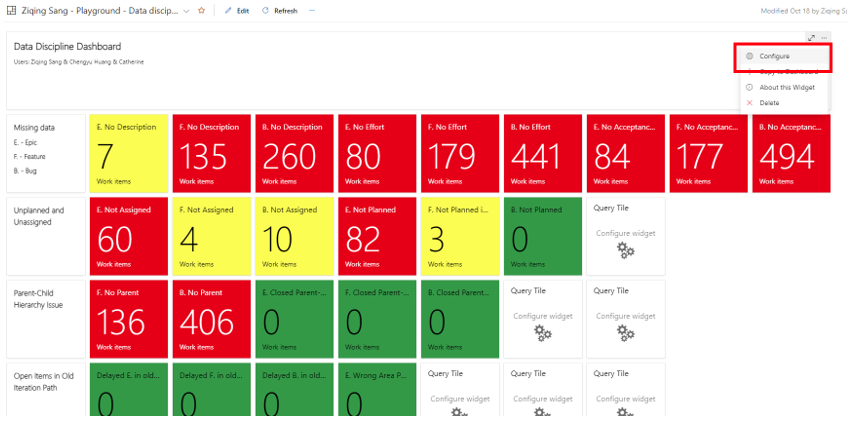
Select “Configure” to edit the query tile. It's possible to change the title, query, and the color standard.
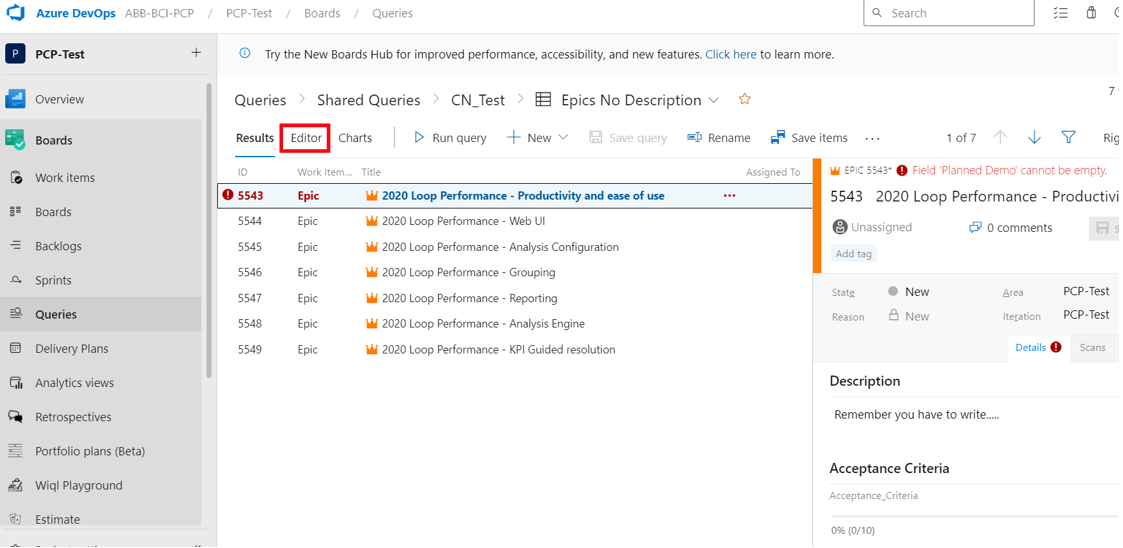
To edit the query, click the widget and then choose “Editor”.
Learn more about queries in Define a work item query in Azure Boards.
Query criteria
Example 1: Open bugs regression
A regression bug is a bug that causes a completed feature that worked correctly to stop working after updates (e.g., system upgrade, system patching, or bug fixes). This definition applies both before and after releasing the feature to customers.
This query can select open regression bugs.
| Field | Operator | Value |
|---|---|---|
| Work Item Type | = | Bug |
| State | <> | Removed |
| State | <> | Closed |
| Area Path | Under | “Team Project Name”\”Stream”\”Product/platform”[\”Major Product/platform Version”\”Target Product/platform Release”] |
| Regression | = | True |
Example 2: Scope bugs
If a bug is found during the development of a release and the change control board (CCB) decides to fix it in a later version, the bug is deferred. When a deferred bug is planned for a future release, it will be considered a scope bug for that release.
This query is designed to select open-scope bugs.

| Field | Operator | Value |
|---|---|---|
| Work Item Type | = | Bug |
| State | = | Any |
| Area Path | Under | “Team Project Name”\”Stream”\”Product/platform”[\”Major Product/platform Version”\”Target Product/platform Release”] |
| ScopeBug | = | True |
Example 3: Scope change after G2
Epics are often created before G2 and already exist in the backlog. Epics can be added after G2 either as a consequence of a change request of a system requirement, a split of a large epic into two smaller epics, or a new enabler epic. Epics needs to be collected at the G2 date to set a baseline. Use a query to catch all epics added to the project scope after G2. Also, some new/active epics are moved to other area paths after G2. The epics that have been added and removed return identical values.
If other work item types are needed for the project scope, it's possible to add more query tiles to monitor the progress. This involves three queries:
-
Query 1: Epics at G2
Create a baseline based on all the IDs of epics at G2.
Field Operator Value Work Item Type = Epic State = Any ID In all the Epics IDs at G2 Tips: How to select all the IDs of epics at G2
There are many different ways to create a baseline. For example, you can use Excel.First, use a query to screen out all the epics at G2. Then export these epics to Excel. Finally, use the “Textjoin” formula to get all the IDs, and then copy these IDs back to ADO as a baseline.
-
Query 2: Epics added after G2
Make a query based on IDs to catch if any epics were added after G2.

Field Operator Value Work Item Type = Epic State <> Removed Area Path Under “Team Project Name”\”Stream”\”Product/platform”[\”Major Product/platform Version”\”Target Product/platform Release”] ID Not In All the IDs of Epics at G2
-
Query 3: Epics removed after G2
Make a query based on IDs to catch if any epics were removed after G2.

Field Operator Value Work Item Type = Epic State = Any Area Path Not Under “Team Project Name”\”Stream”\”Product/platform”[\”Major Product/platform Version”\”Target Product/platform Release”] ID In All the IDs of Epics at G2