Color Guide for Azure DevOps
Recommendations of colors for dashboards and graphs in Azure DevOps.
The key objectives of this guideline are to:
- ensure consistent look and feel of dashboards and graphs.
- avoid misunderstandings during SteCo meetings and when sharing information with various stakeholders.
- facilitate and enable efficient comparison of dashboards and graphs from different projects/streams.
A general common sense approach should be applied:
- Something considered “good” or ”completed” should be green, e.g., WI state = Closed, etc.
- Something considered “bad” or ”open” should be red, e.g., WI state = Open, Severity = Critical etc.
PCP R&D quality dashboards
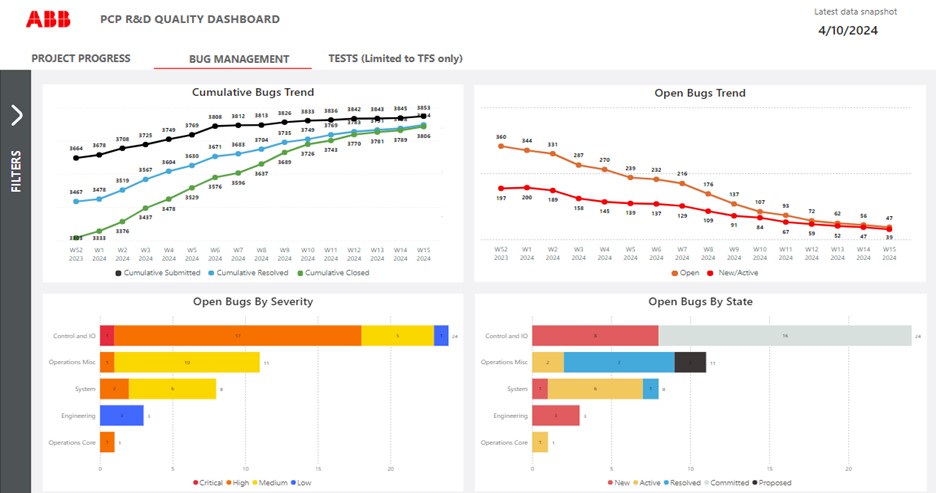
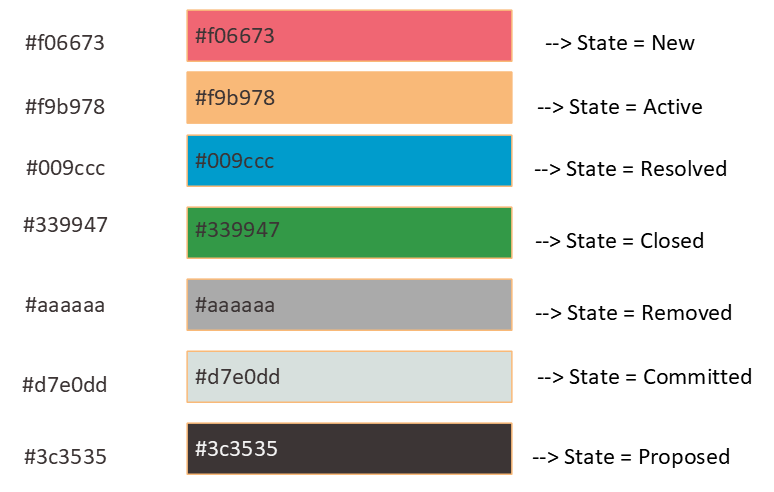
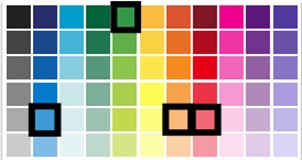
Colors used for graphs based on state
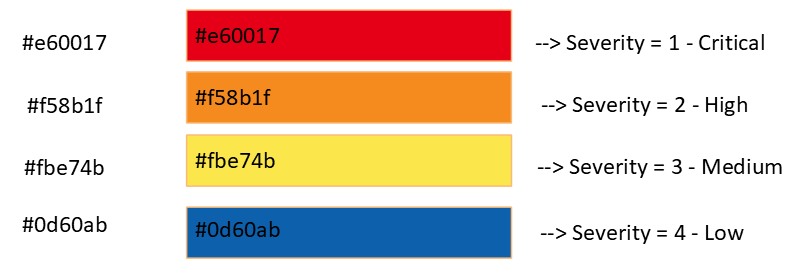
Colors used for graphs based on severity
Azure DevOps dashboards
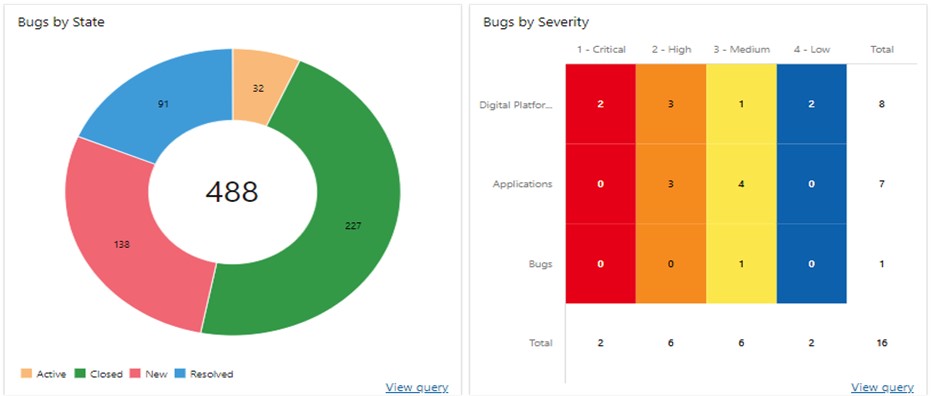
To follow the general common sense approach applied, the following colors are recommended to be used in the Azure DevOps dashboard and graphs.
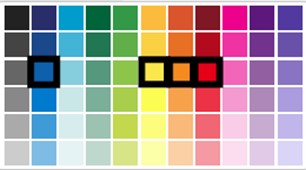
Colors used for graphs based on state (always sort by label --> ascending):

Colors used for graphs based on severity (always sort by label --> ascending):

Note
The colors that are already set/changed in the Azure DevOps dashboards and charts will be reset to defaults every time you change the query behind them, a possible workaround is to tick off “Select folder to copy dashboard queries” while creating a copy of dashboard and then just update newly created queries.
MS Office charts and graphs
To follow the general common-sense approach applied, the following colors are recommended to be used in MS Office charts/graphs:
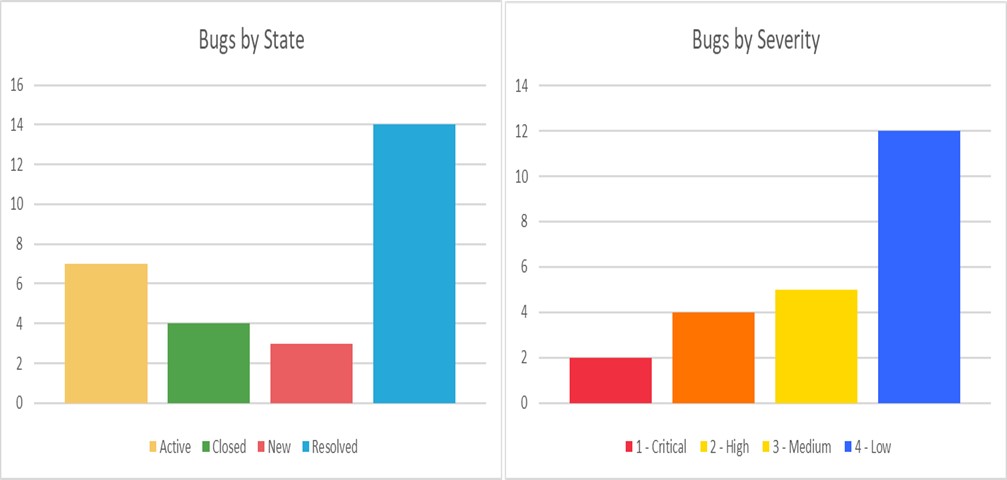
Colors used for graphs based on state (always sort by label --> ascending):
Colors used for graphs based on severity (always sort by label --> ascending):